Gap Tools – Analyzing First Minute Of Trading
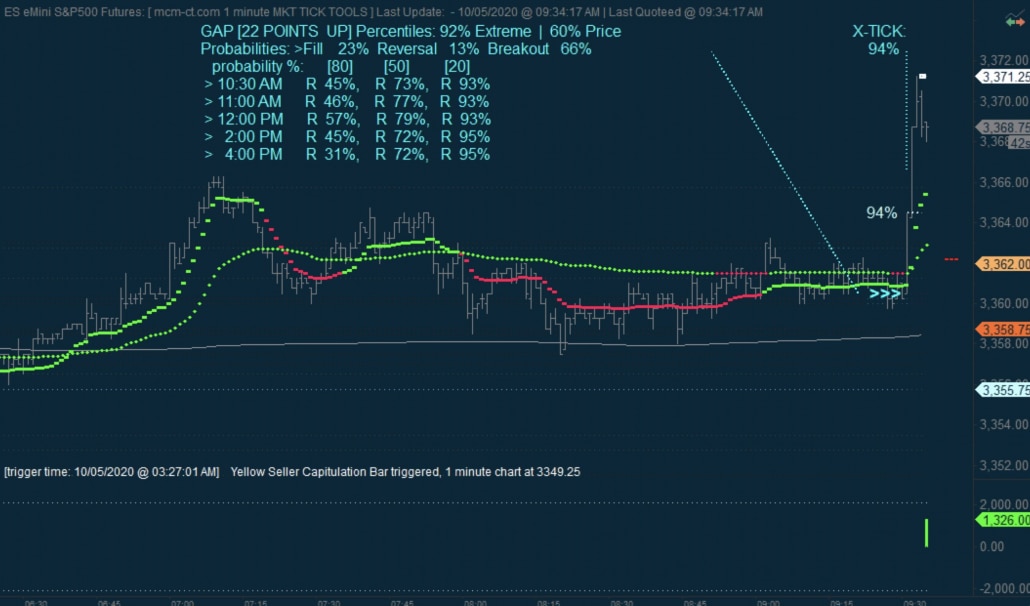
Gap Tools are a revolutionary way of looking at the first minute of trading for the cash session. When a Gap of statistical significance occurs - it is instantly analyzed, and three probability scenarios get calculated.
There is tremendous information available on the first bar of trade using the Tick Tools framework and database and a sophisticated database of many metrics and emotional profiles of all gaps in the last 20 years. It enables a very accurate ranking of the current Gap on price movement, Emotion, and Market Structure. The objective is to understand the implications of a Gap on a full day of market behavior and avoid much or the misconception regarding gap trading. Some Gaps will rank highly in terms of "Gap Fill" probability, while others will rank highly for the "Gap and Go" possibility. Still, others will rank highly for "Gap and Reverse".
There is a tremendous misunderstanding by market participants about what is normal behavior for trades following a gap. Thankfully Gap Tools clears this up.
Other sophisticated features of Gap Tools include plotting open gaps with precise and real-time plotting on the charts. Gap Fill tolerances can indicate when any open gap comes into a fill range and when and how it fills.
One of the unique capabilities of Gap Tools is to completely and accurately calculate Gaps on the Cash Indexes, which is impossible to do normally. For the DOW and S&P500, many of their markets are cash sessions traded only and take a few minutes to open and thereby distort the chart's actual gap prices. However, the Gap Tool uses a highly accurate method to harmonize Gap Details and is plotting them accurately against a cash chart. The historical Gap Levels can be plotted as support and resistance lines with display configuration able to view the most significant and essential Gap resistance and Support.
The last feature of the Gap Toolset is that the structure of the database allows for display of the Gap data based on detailed criteria on any timeframe chart and also contains the complete history of all gaps meeting that criteria. Any historical period of gaps can be displayed and rendered on any chart.

