
LEVELS – Market Support and Resistance
Support and Resistance in the markets are most often drawn and calculated where it looks good but NOT where it is. Our price analysis tool operates, unlike any other.
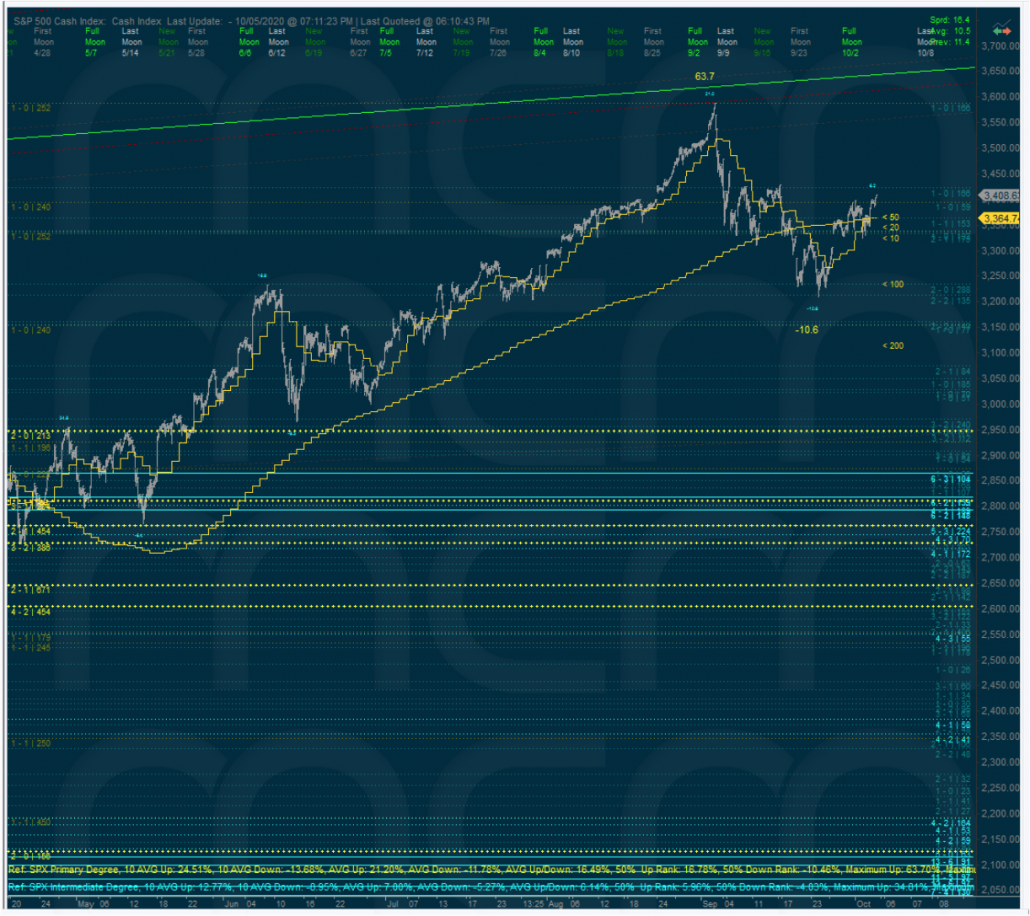
It analyses every wave on the cash markets on a 1 to 5-minute basis and locates the inflection points where markets turned. Support and Resistance are then rendered based on this data in aggregate. Also, the points traveled into and out of the number of times support, and the number of times Resistance is calculated and plotted on charts.
This technique works so much better than others because the average market volatility is getting exempted. ONLY valid market inflection points meeting the criteria are getting accepted for the calculation. Additionally, a smart harmonization layer is applied to aggregate the results appropriately by price significance and strength.