Lessons Learned Part1
This will be the 1st article of the "Lessons Learned" series. The aim is to discuss the most important set-ups on the mcm tools from the previous week and how they should be approached when they show up again.
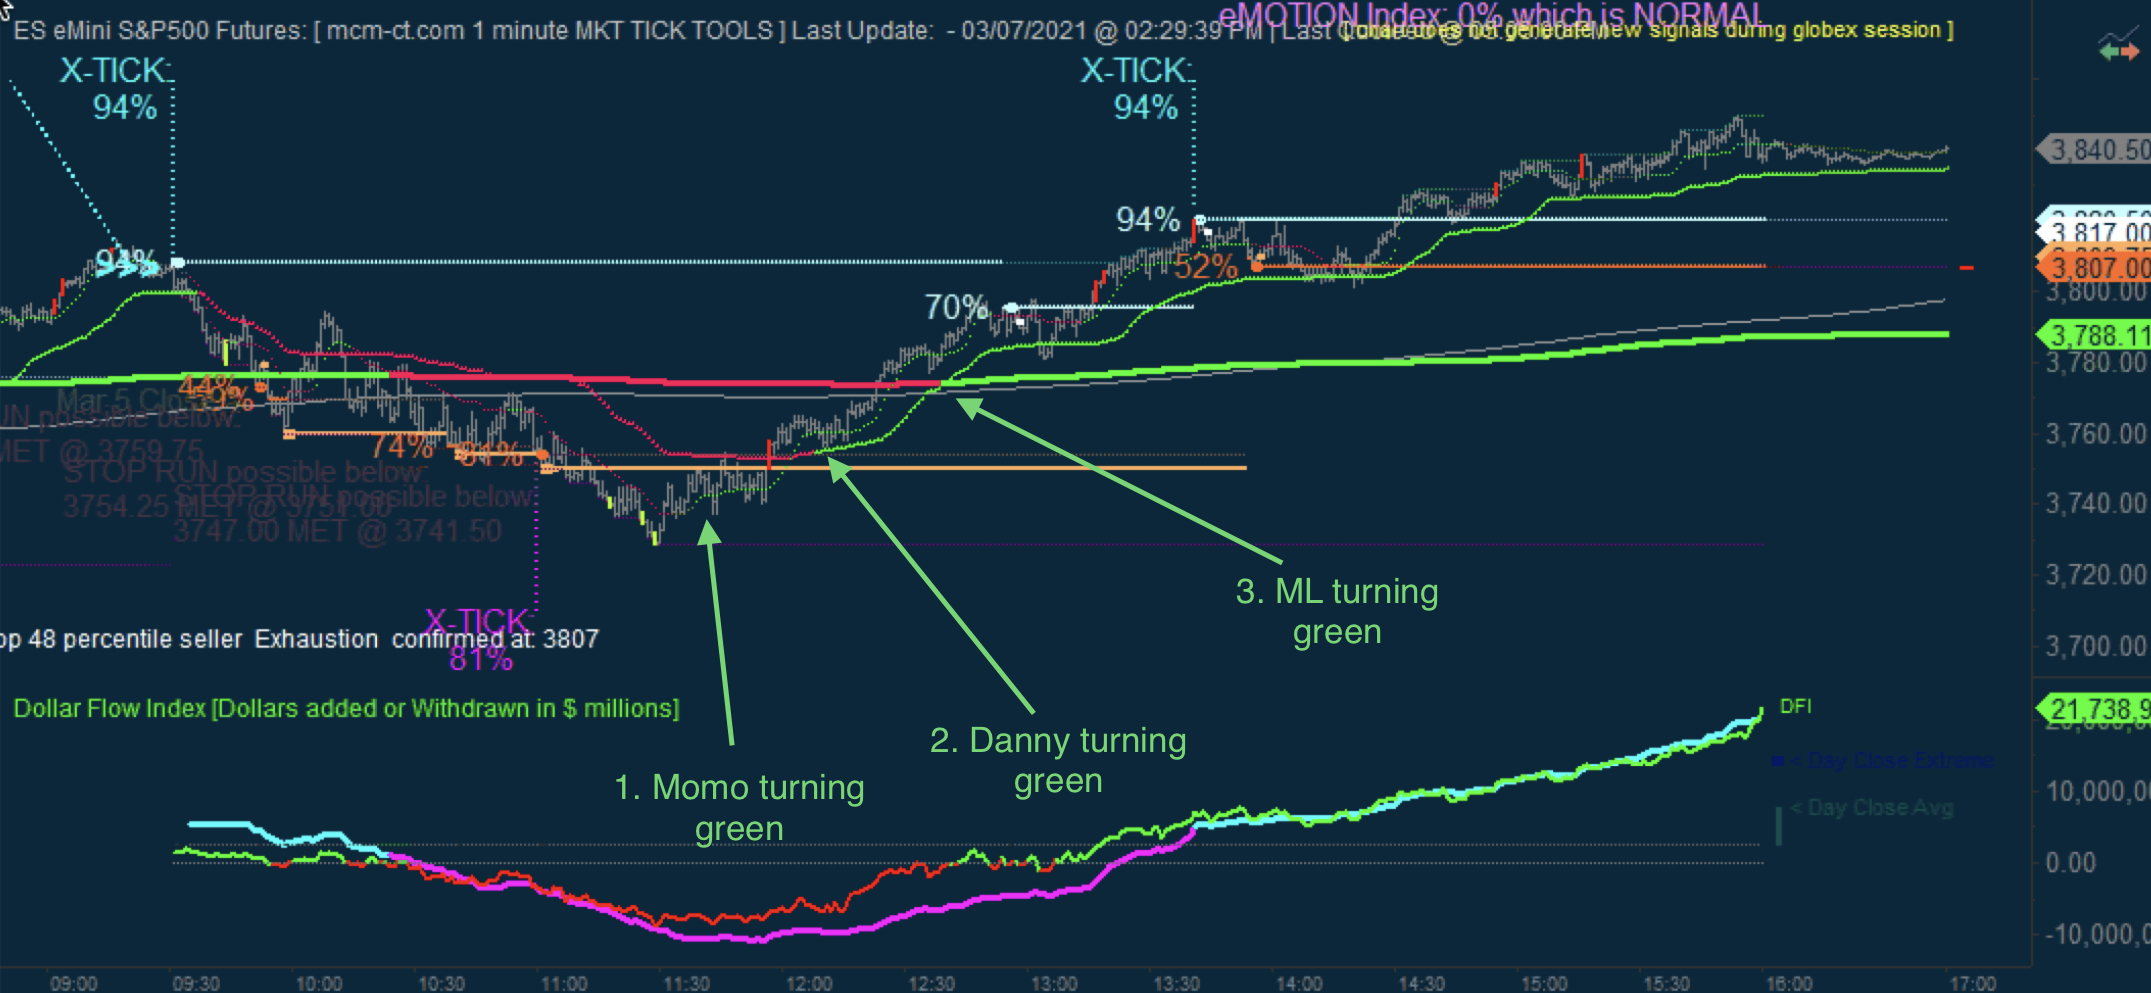
First up is Tick Tools, which was amazing on Friday. It nailed the top off the cash open with a big Buyer Exhaustion (BE) Xtick from which the market sold off strongly. And also the low with a strong Seller Exhaustion (SE) Xtick that was overshot and then won back. If shorting the opening BE Xtick was a classic (and easy) play, playing the bounce once such a strong down trend is established (4 SEs broken, one being an Xtick) can be more stressful, however it doesn't need to be. The 1st thing to watch for, when looking for an attempted bottom, is price to break above momentum line (momo) and then for it to change colour to green. The 2nd thing is for the last broken SE level to be won back. Then the attention should be directed to the other important lines - danny, 400bar MA and finally ML.
Friday provides a great example of this set-up, as we had all confirmations one after the other.
As can be seen in the chart, the exact low was on a seller capitulation bar (the 3rd one in the same area). After that, price broke above momo and it turned green. After a few whipsaws just below the SE Xtick level and danny, price broke above both and the next big tell that an important low was in the making was price back-testing danny, which held as support AND turned green. Then followed the breakout above the 400bar MA and ML and then ML was back-tested, it held as support, and then ML turned green. All those signs were just one confirmation after another that the odds were shifting in favor of the buyers. The most bullish scenario played out once the reaction off the 70% BE was held by ML as support, which triggered a breakout. The big 94% BE Xtick might have marked the top, but getting a SE immediately after that at such a high level was a clear sign sellers were caught wrong-footed and were gonna get squeezed as long as the SE lvl held (which it did).
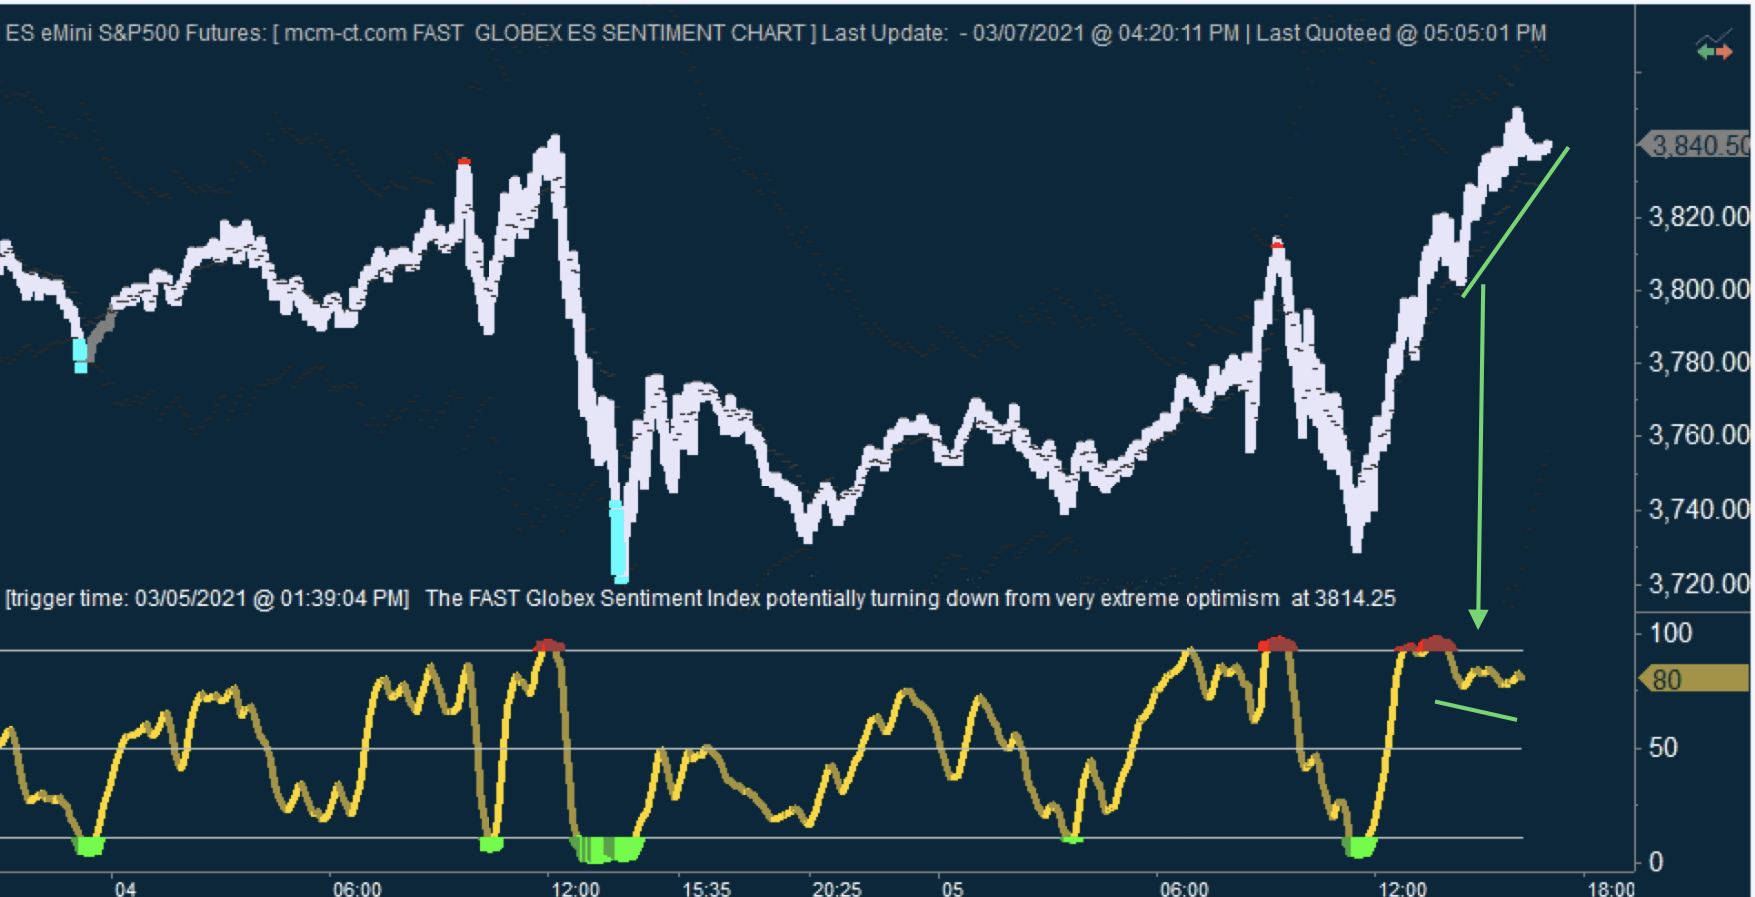
Next up is FGSI. The obvious signals were - extreme optimism (red zone) off the high from the cash open (which added weight to the BE Xtick signal from TT) and extreme pessimism (green zone) at LOD (which was also a sign to look for an attempted bottom). However, it's important to also discuss what happened next. It got to the red zone again pretty quickly on the run up from LOD and then started to move down to sideways, even if price kept moving higher. That is a set-up which indicates a very likely squeeze up, as market participants try to sell (increase in pesimmism), but are totally unable to move price and are getting run over.