Lessons learned part 3
Last week we had fireworks again, with the first 3 days being very bearish, while Thu-Fri provided a vertical V-shape rebound, with up gaps on the cash sessions on both days.
There were quite a lot of great tells from the mcm tools, so let's dive right into the "lessons learned".
- IGSI unconfirmed low set-up
Unconfirmed lows on IGSI are very powerful set-ups and are normally good for a lot of points. A great example is the actual move off the Thursday morning low, which was unconfirmed on IGSI. However we actually had 2 unconfirmed lows set-ups, the first of which failed. Let's see the main differences between the two.
On Tuesday we had an unconfirmed low on IGSI, but the initial bounce off that low triggered bearish EE which held and pushed price lower. The unconfirmed low was held initially, but the bounce off there triggered again a bearish EE which also held. The next trip lower broke decisively the unconfirmed low and the market flushed.
On Thursday we again had an unconfirmed low on IGSI, but this time, buyers never hesitated and rocketed off there.
The main take-away is that the confirmation lvl for the upside set-up of the unconfirmed low on IGSI is the peak of the prior IGSI high before the unconfirmed low. If IGSI shows bearish EE vs that lvl, it is best to be cautious and raise stops on positions entered at the unconfirmed low.
2. FGSI up squeeze set-up
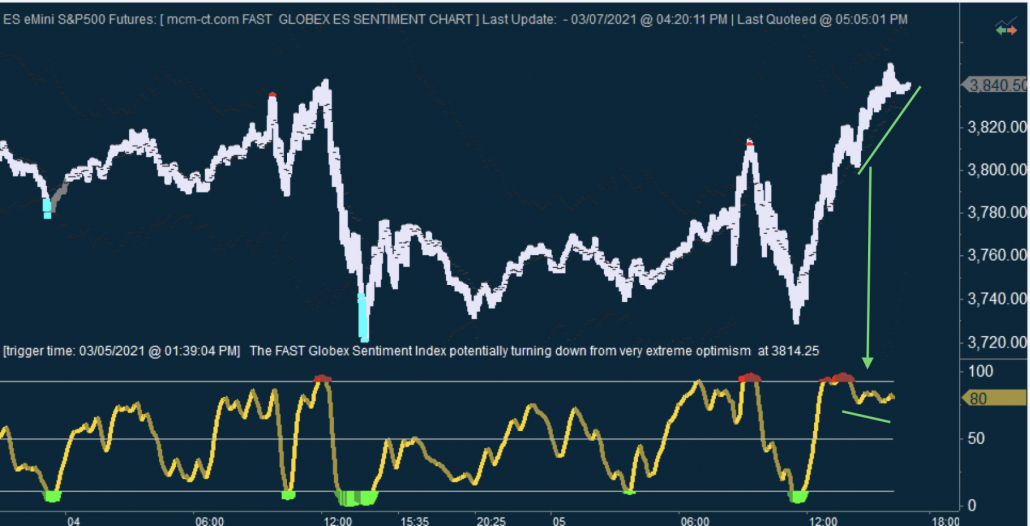
Normally when FGSI is at extreme optimism (red zone) it indicates a top and reversal is close. However the "up squeeze" set up happens when FGSI is in the red zone and starts pulling back, while price keeps hovering near the highs or even makes new highs. That indicates that market participants are increasingly pessimistic, but are unable to move prices lower. Ideally this sort of set up is completed by a breakout on Tick Tools (TT), like a breakout over a buyer exhaustion (BE) or an important level, like the maginot line (ML).
We had also 2 up squeeze set ups on FGSI last week, one failing and one playing out well.
The 1st one occured on Thursday. After the big bounce off the unconfirmed low on both FGSI and IGSI, FGSI reached extreme optimism (red zone). But price continued higher, as FGSI started to come lower from there. On TT we had broken out a BE just after the cash open and everything was looking good for the up squeeze set-up. TT even triggered a Seller exhaustion (SE) above the broken BE, but the big warning came immediately after that when a new BE was triggered. That turned out to mark the high for the day and the market retreated quite strongly from that level.
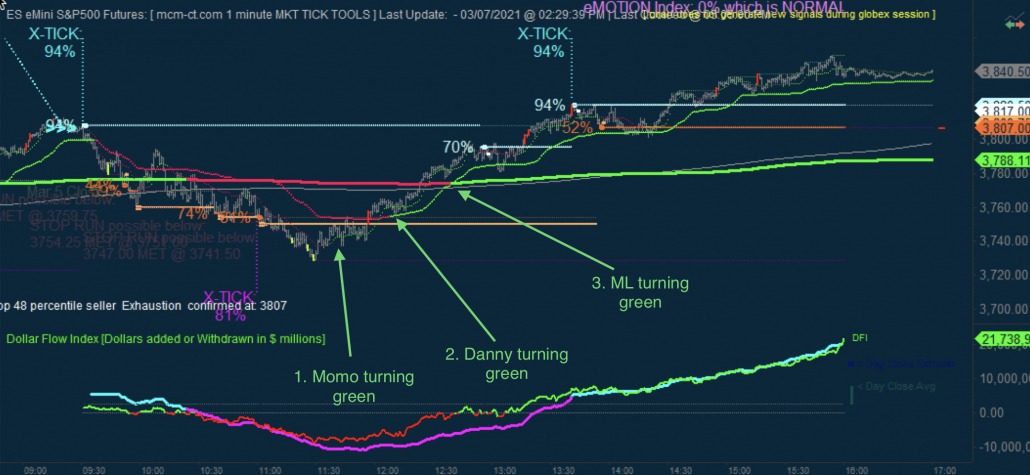
The 2nd one occured on Friday and this time there was no stopping the buying stampede. We had almost the exact set-up. FGSI moved to the red zone, then started pulling back, while price kept climbing. TT had broken a very strong 100% BE Xtick and held the back-test. Then came a SE above the broken BE Xtick (so far exactly like the set-up from Thursday), but this time no BE triggered and the coast was clear for buyers to continue higher. This is exactly what happened as price grinding higher for almost the entire session, with only the last 1h sesing a few whipsaws both down and up, and closed near the highs of the day.
The main take-aways is - the up squeeze on FGSI is a powerful set-up, but must be completed with signals from TT. If a BE hits that caps price and then a SE gets broken, those are strong signals the buyers are not in control any more. If TT signals that the up trend has little resistance, then the up grind can continue unabated for quite a bit. As can be seen, an additional confirmation on Friday was that price held the danny line all the way until the last 1h whipsaw. That is indicative of a strong up trend.


